My Feature
For the CPT project I created a chest opening simulation based of the game Clash Royal. I also worked on the Login/Signup system and creating user roles such as admins. I also added things like a page to view our backend user database in the frontend, and a way to edit/delete users which would update our database. My individual feature displays 2 chests, one gold, and one legendary (Both from the game). If a user clicks the Gold chest, a function generates 8 random cards from the card database, and adds them to the logged-in user’s collection. The other chest generates 4 cards, with a higher rarity. I created a seperate database for each users collection, so that t collection displayed would be based on the user you are logged in as. This database assigns card IDs to User IDs. Our team teach this trimester was JWT Admin/User roles. For this I created the admin role and with Dante’s help making sure that the admin role was displayed in the cookie, I made it so only Admins could delete users. For the Machine Learning project, I created an NBA win predicter, that uses previous game data to determine a winner between two NBA teams.
What Is Clash Royale
Clash Royale is a very popular mobile game based around cards. There are about 120 cards in the game curently, and each card has a rarity and elixir cost, along with its seperate stats. Rarity can vary between, common, rare, epic, ledgendary, and champion, each one increasingly rare. There are several chests that can be won by winning battles, and each chest gives some cards to the player. Our enitre project followed this theme, and we created features like a deck builder, a tornament tracker, a custom survay, and a deck information page.
Collections
| Requirements | My Feature |
|---|---|
| From VSCode using SQLite3 Editor, show your unique collection/table in database, display rows and columns in the table of the SQLite database. | This database contains the data for each users collection of cards, which is my feature. Cards are added to this database after the chest is opened.  |
| From VSCode model, show your unique code that was created to initialize table and create test data. | This is the code initializing the table in my model file. It creates a relationship between the Card IDs with User IDs. 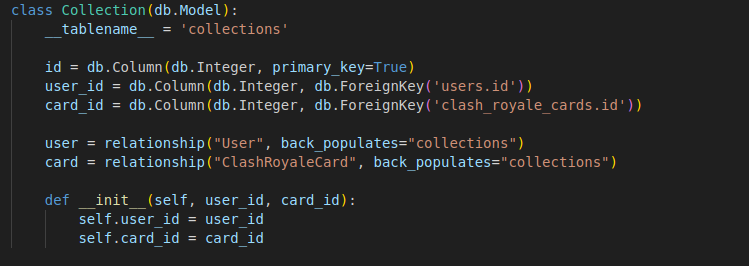 |
Lists and Dictionaries
| Requirements | My Feature |
|---|---|
| In VSCode using Debugger, show a list as extracted from database as Python objects. | I debug my collection feature with a breakpoint in the endpoint code. It calls the class and hits the breakpoint. Then I step throught the function as the data gets sent to the frontend.  |
| In VSCode use Debugger and list, show two distinct example examples of dictionaries, show Keys/Values using debugger. | This show two dictionarys of cards, with atributes such as rarity and elixer cost.  |
APIs and JSON
| Requirements | My Feature |
|---|---|
| In VSCode, show Python API code definition for request and response using GET, POST, UPDATE methods. Discuss algorithmic condition used to direct request to appropriate Python method based on request method. | This is my API endpoint code that uses a GET method to obtain the data from my backend. The class defines another resource for retrieving a user’s collection of Clash Royale cards from the database. It also includes tje Class that is called when a user opens a legendary chest. It creates 4 cards with raritys epic or higher.  |
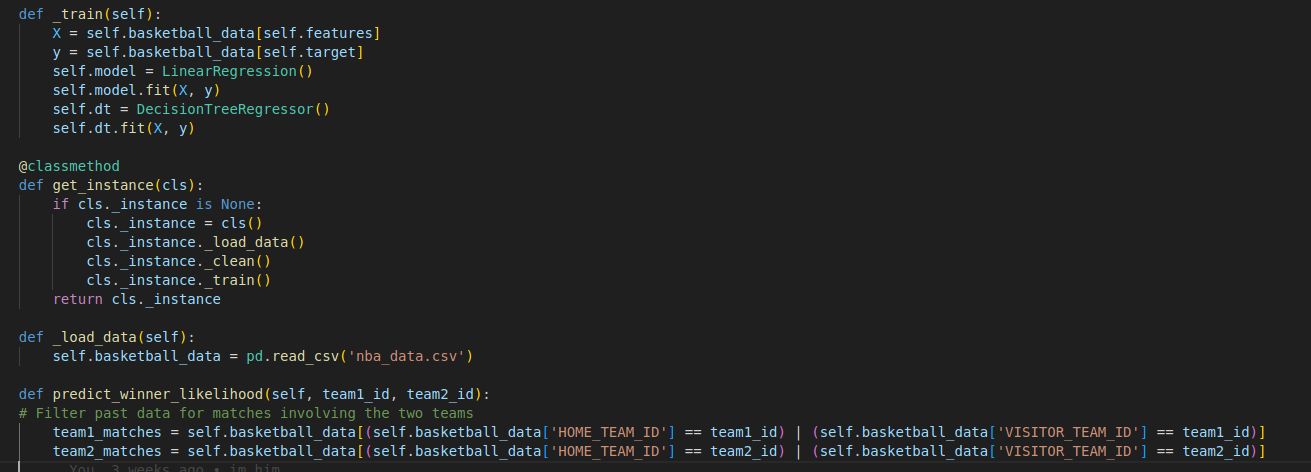
| In VSCode, show algorithmic conditions used to validate data on a POST condition. | This is my API endpoint code for my machine learning project. It recives the team IDs imputed by the user in the frontend, and validates it by checking if the value is null or is the value is not an integer. If that is the case it returns a bad request error. If the team IDs are valid, it imputs them into the prediction model to get the win rate. 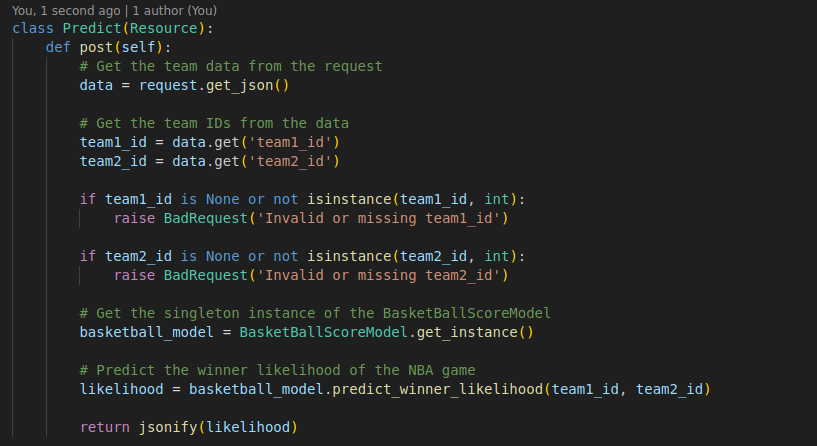 |
| In Postman, show URL request and Body requirements for GET, POST, and UPDATE methods. |  |
| In Postman, show the JSON response data for 200 success conditions on GET, POST, and UPDATE methods. | 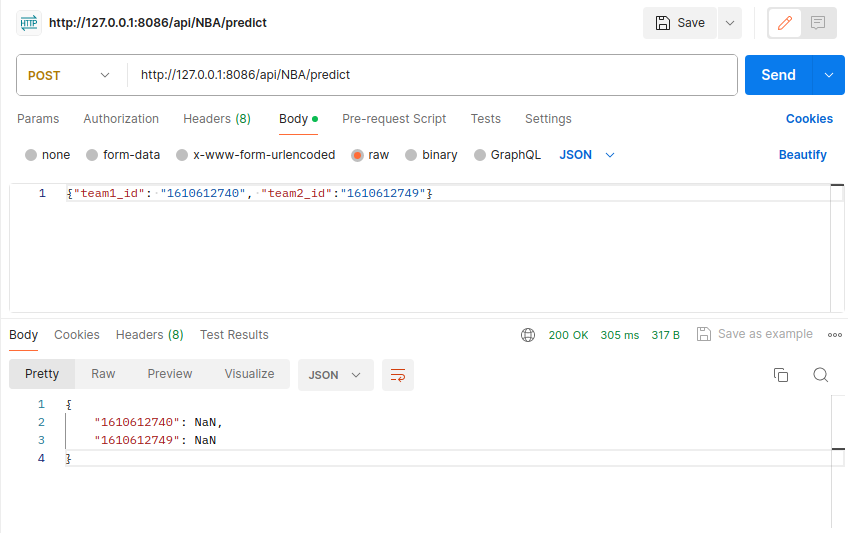 |
| In Postman, show the JSON response for error for 400 when missing body on a POST request. | 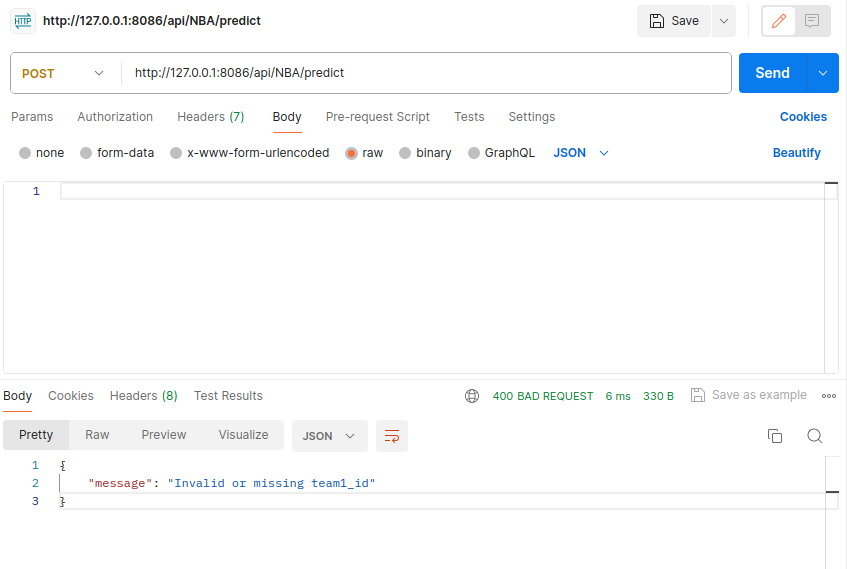 |
| In Postman, show the JSON response for error for 404 when providing an unknown user ID to a UPDATE request. | 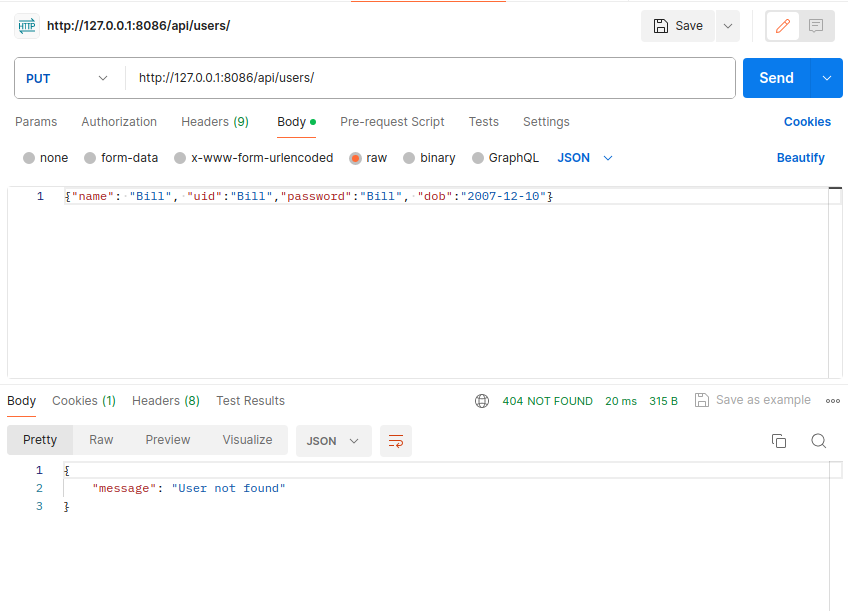 |
Frontend
| Requirements | My Feature |
|---|---|
| In Chrome inspect, show response of JSON objects from fetch of GET, POST, and UPDATE methods. | 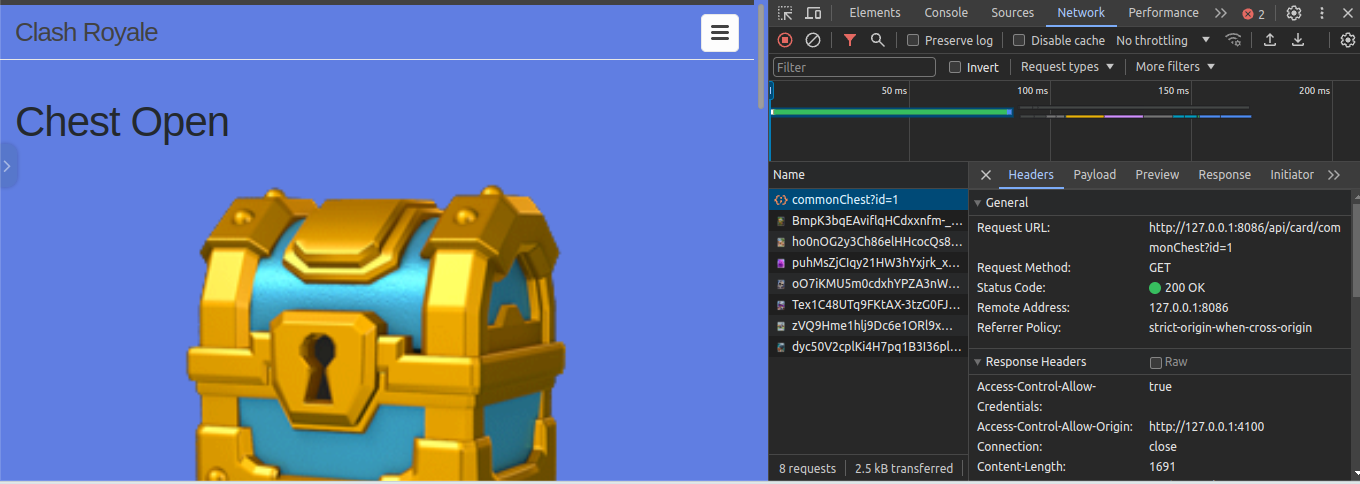 |
| In the Chrome browser, show a demo (GET) of obtaining an Array of JSON objects that are formatted into the browsers screen. | I will demo opening a chest. The card data is formated into containers and displayed in a card format with the image displayed. |
| In JavaScript code, describe fetch and method that obtained the Array of JSON objects. | This fetches the variable API endpoint, that will change depending on what chest you click on.  If the Gold chest is clicked on, it goes to the common chest API, and if the Legendary chest is clicked it fetches its respective API. Here is that code If the Gold chest is clicked on, it goes to the common chest API, and if the Legendary chest is clicked it fetches its respective API. Here is that code  |
| In JavaScript code, show code that performs iteration and formatting of data into HTML. | This iterates through the card data from the backend, and creates the container in HTML so it can be displayed with the card image icons.  |
| In the Chrome browser, show a demo (POST or UPDATE) gathering and sending input and receiving a response that show update. Repeat this demo showing both success and failure. | I will open a chest with the endpoint code functioning, and open a chest with the backend turned off to demonstrate a failure. |
| In JavaScript code, show and describe code that handles success. Describe how code shows success to the user in the Chrome Browser screen. | This code runs the cards from the fetch data into a display fards function that appends the cards to their containers, created in the styling.  |
| In JavaScript code, show and describe code that handles failure. Describe how the code shows failure to the user in the Chrome Browser screen. | This checks the data fetched from the backend. If the data array of cards is empty it returns an error message with the data recived into the console. This is very helpful while debugging to see what data is being sent from the backend easily. In the browser screen it displays a simple error for the user.  |
Extras
-
Show algorithms and preparation of data for analysis. This includes cleaning, encoding, and one-hot encoding.

-
Show algorithms and preparation for predictions.
-
Discuss concepts and understanding of Linear Regression algorithms.
Linear Regression is a fundamental statistical method used to analyze and understand the relationship between a dependent variable (such as house prices) and one or more independent variables (like size or number of bedrooms). This method assumes that this relationship can be approximated by a straight line. Imagine plotting data points on a graph where the vertical axis represents the dependent variable and the horizontal axis represents the independent variable(s). Linear Regression aims to find the best-fitting line through these points by adjusting the slope and intercept of the line to minimize the difference between predicted values and actual data points. This technique is widely used in various fields such as economics, finance, and engineering to make predictions or infer relationships between variables.
- Discuss concepts and understanding of Decision Tree analysis algorithms.
Decision Trees are a type of model used in machine learning and data mining for making decisions based on input features. They resemble flowchart-like structures where each internal node represents a question or a test on a specific feature, each branch represents the possible answer or outcome of the test, and each leaf node represents a final decision or classification. Decision Trees are used for both classification and regression tasks and are particularly useful for understanding the underlying patterns in data. They can handle both numerical and categorical data and are capable of capturing complex relationships between variables, making them versatile for various applications such as customer segmentation, fraud detection, and medical diagnosis.